


This report provides estimates of the quantity and types of food and drink waste generated by UK households in 2021/22. The report also looks at the reasons for discarding, the financial cost, and the greenhouse gas (GHG) emissions related to wasted food.
Why are these findings important?
- Food waste is a global environmental issue. In the UK, households generate the most food waste, which not only has a big environmental impact but it also costs us a lot of money.
- These findings help us understand where to target action helping all stakeholders to act now on food waste – both in the supply chain, and household as this is where most impact can be felt. Failure to act will mean we don't meet the 2030 food waste target.
- It is imperative, at a time of high food insecurity – both internationally and in the UK – that action is taken from field to fork. The environmental and financial costs of food waste are too high not to.
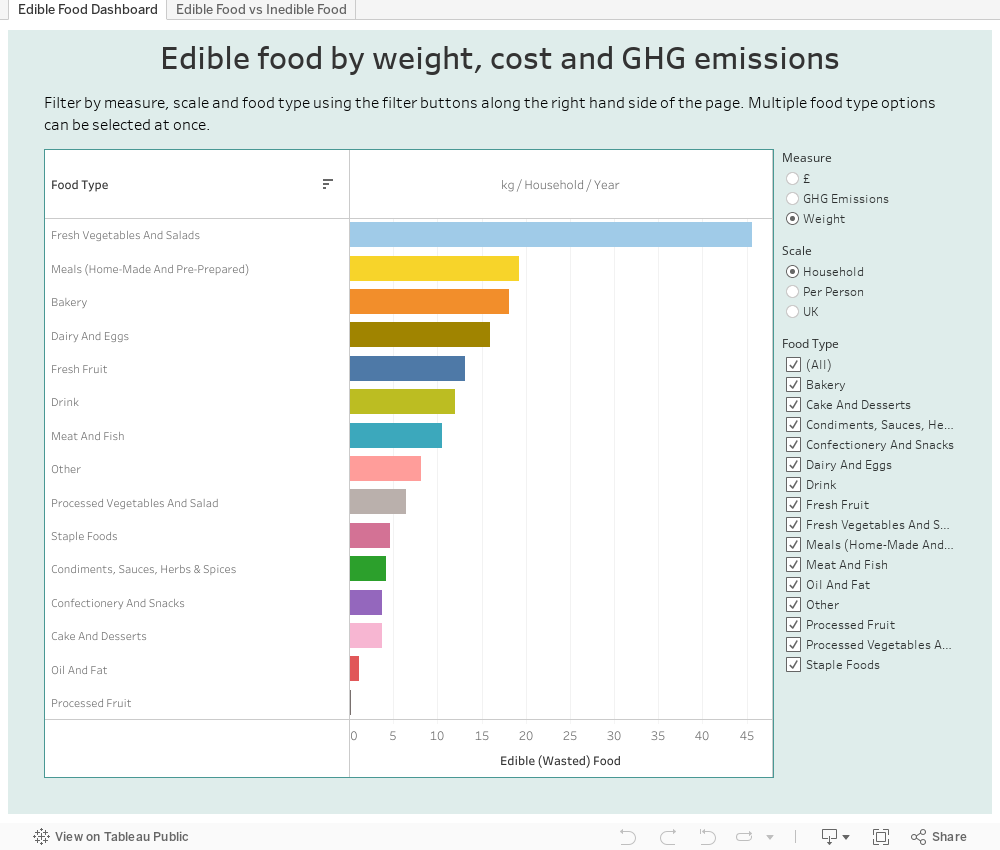
Read the key findings below and navigate the data with our data visualisation tool.
How much household food waste is generated?
- In 2021/22, 6.4 million tonnes of food (and drink) waste was generated from UK households. This equates to 95 kg per person per year or 247 kg per household of 4 people.
What are the environmental impacts of household food waste?
- The greenhouse gas emissions (GHG) associated with wasted food and drink (i.e., edible parts) in the UK accounted for approximately 18 million tonnes of CO2 equivalent in 2021/22.
This figure includes contributions from the relevant elements of the food and drink system: land-use change, agriculture, manufacture, packaging, distribution, retail, transport to the home, storage and preparation in the home, and waste treatment and disposal.
How much does throwing away this food cost us?
- The cost to householders of purchasing food that was subsequently wasted in 2021/22 was £17 billion.
- This figure equates to £250 per person each year or £1000 for a household of four.
What types of food are most wasted and why?
- When assessed by weight: fresh vegetables and salads is the most wasted category, followed by meals (homemade and pre-prepared), bakery, and dairy & eggs.
- When assessed by the cost of purchasing food that is then wasted or greenhouse gas emissions associated with wasted food: meals and meat & fish come out on top.
- Food not used in time - it either smelled or looked off, or was past the date on the label accounted for 40% of the waste.
- 25% was associated with too much being prepared / served and 22% was associated with people not wanting to eat that element of the food or perceiving it as inedible.
Navigate the data.
Download files
By downloading resources you are agreeing to use them according to our terms and conditions.
These files may not be suitable for users of assistive technology.

